Beginning today through May 1, 2020, we are making Analytics free for all Mobile Tech RX customers and future customers on any subscription plan. We know that the coronavirus pandemic is a challenging time for many in the auto recon industry. We want to do what we can to help businesses in our community survive and thrive. You most likely have some challenging decisions ahead, and we want to help you make the smartest decisions you can for yourself, your employees, and the community you serve. We hope having Analytics as a free tool will give you all of the information you need to fight through this challenging time.
The companies that make smart decisions now in the midst of uncertainty are the ones who will win in the long run. You’re likely thinking about whether you need to cut expenses or if it’d be smart to double down on marketing. To make big decisions like that, you need visibility into your business to know how to prepare. Mobile Tech RX Analytics is a powerful tool that offers you the visibility you need to understand how your business is performing when it’s more important than ever. By taking advantage of your own real-time business data, you can better understand your business and prepare for the future.
Starting today, you’ll be able to use Analytics for free through May 1st.
3 Ways to Use Analytics for Better Decision-Making
If you’re a current user, you now have access to Analytics on your current subscription! Just log out and log back into the app and Admin Portal to see your Analytics page. You’ll find your Analytics page in your Admin Portal by clicking on ‘Analytics’ on the top menu bar. There are multiple reports in Analytics that will help you make smarter decisions over the next few months. But there are 3 dashboards we think will be most useful for managing a business through uncertain times:
1. Overview Dashboard
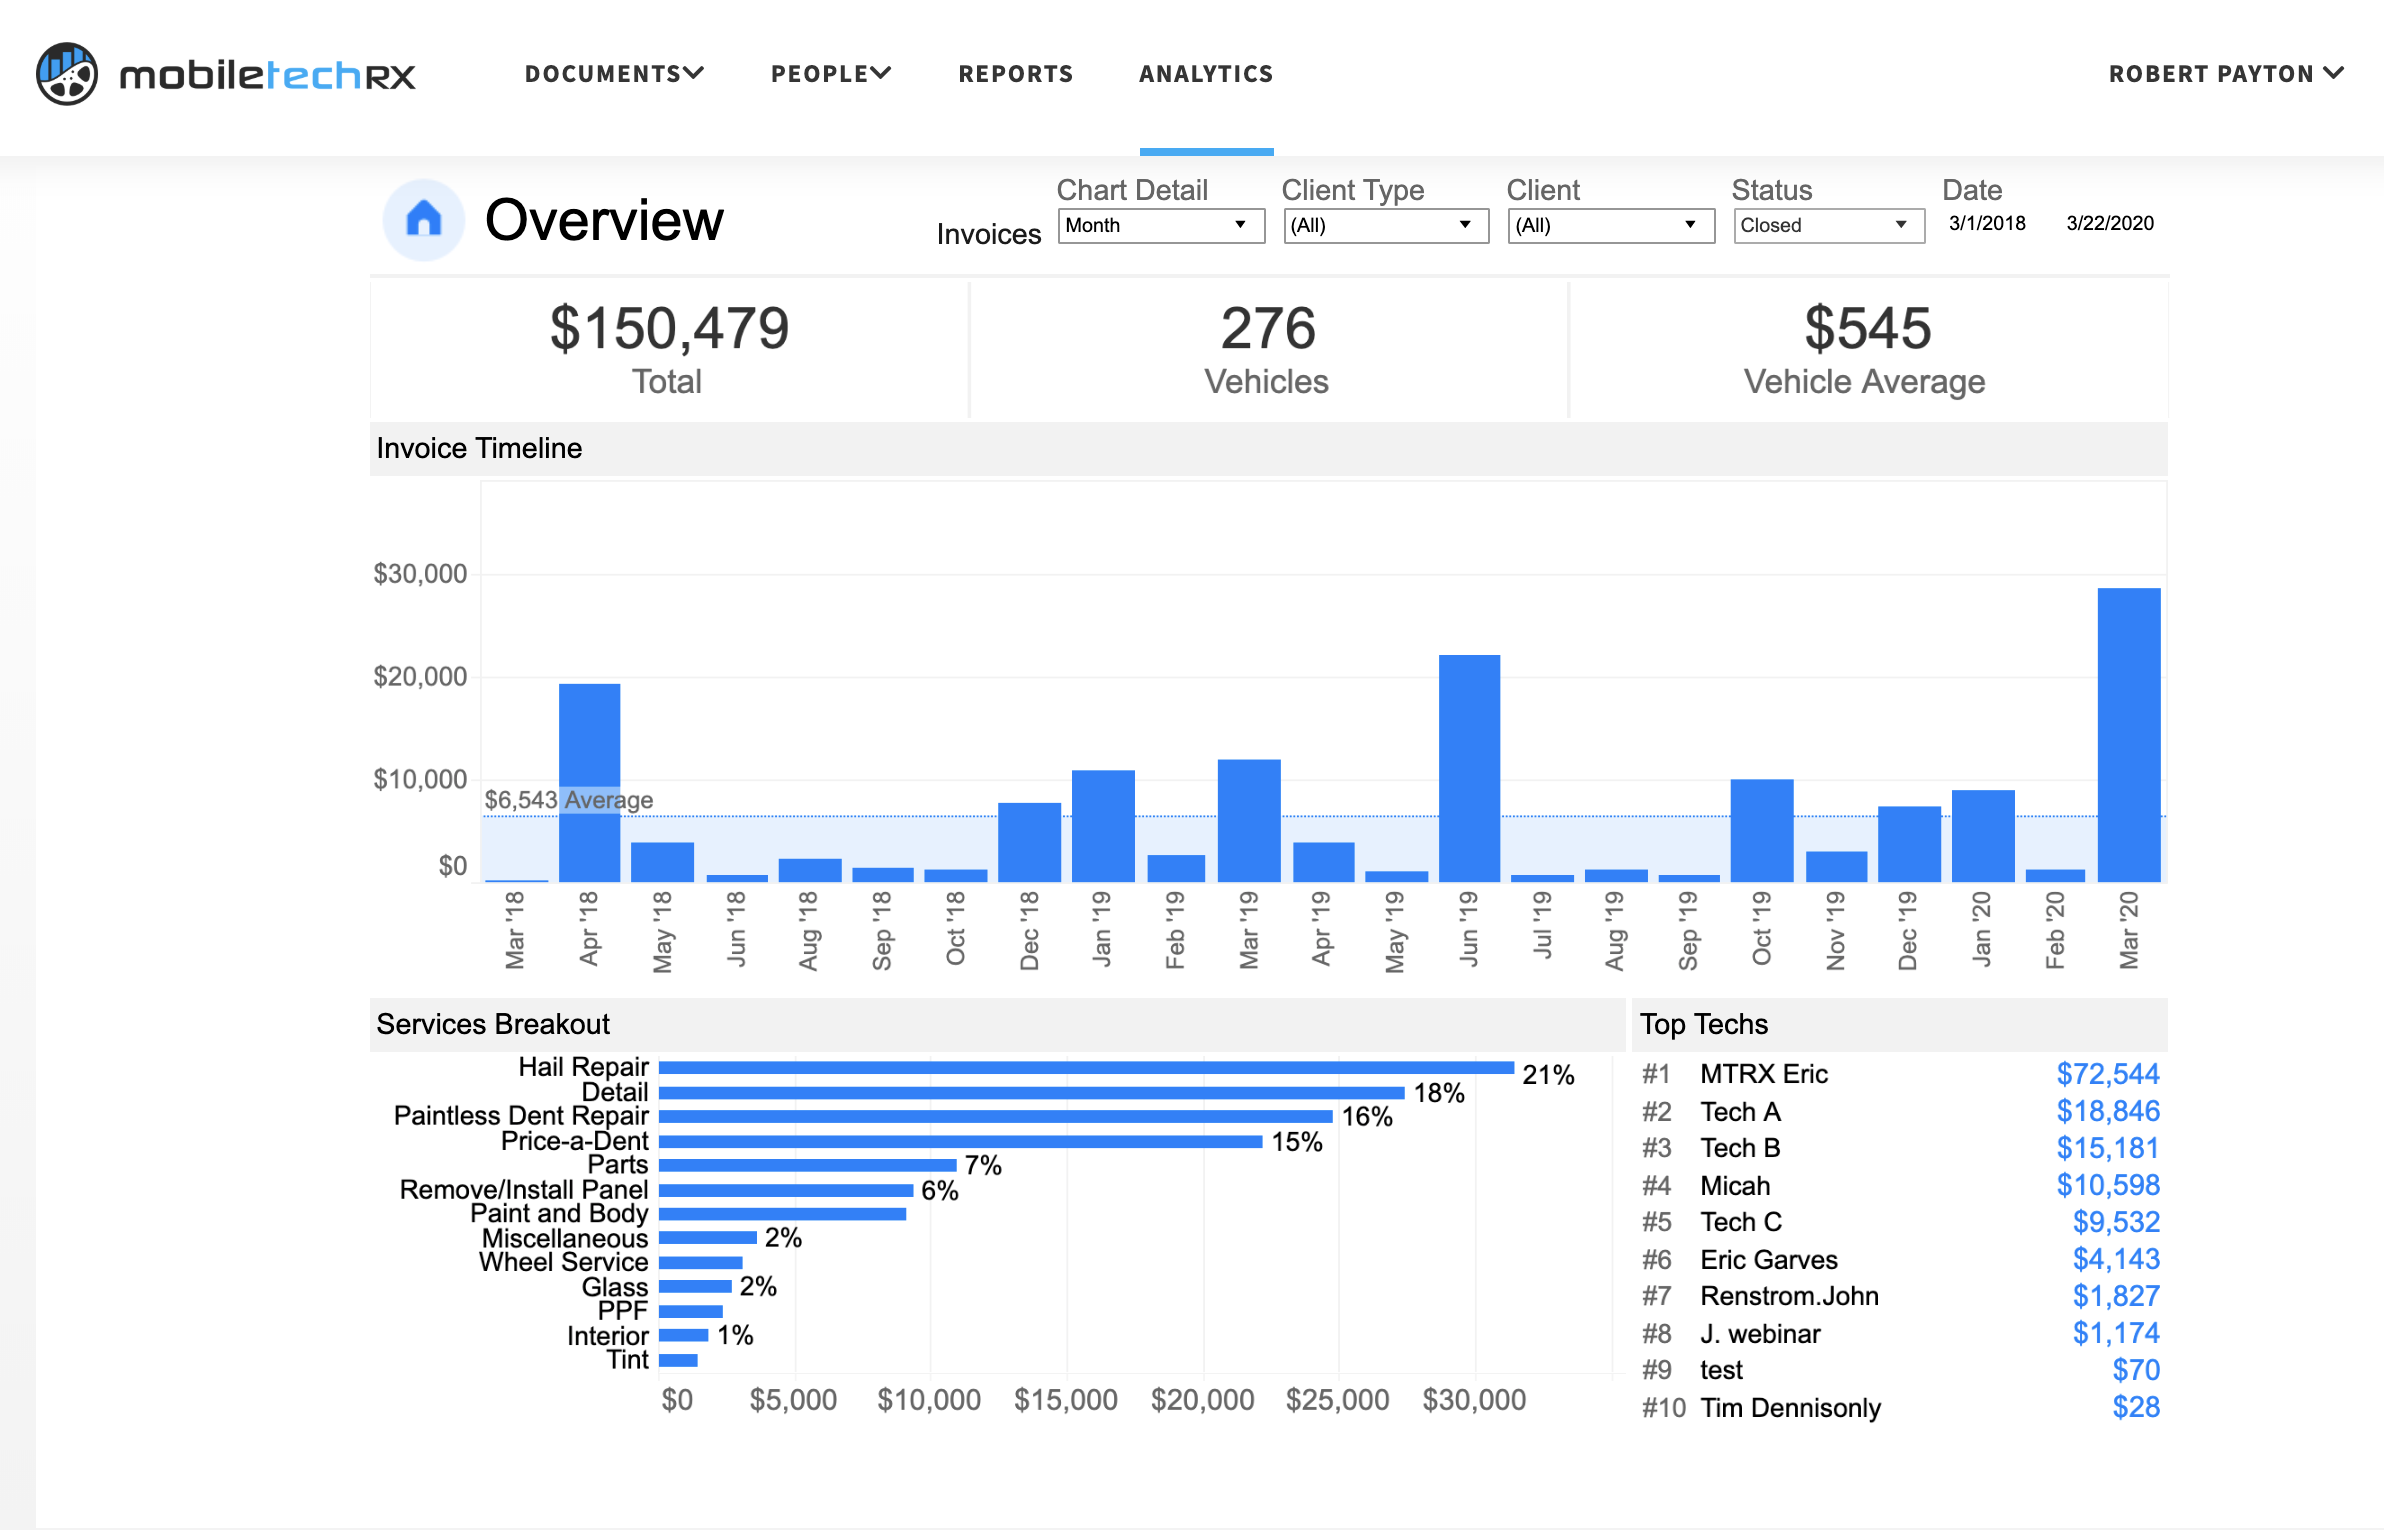
The Overview dashboard is the best comprehensive view of your business. First, choose your date range; this will help you compare historical data to the present. For the period of time that you chose, you can see the amount invoiced, number of vehicles serviced, and services provided in chart form.
Over the next few months, you should track your Overview Analytics consistently (every day) to see your business performance. Seeing the information regularly will help you see changes as they happen and react when necessary. You can display this dashboard by airplaying it to a TV in your shop or at home to track ups and downs over the next few months.
You can also use this dashboard to create point-in-time comparisons between months, quarters and years. (A quarter is a 3-month period of time, ie: January to March, April to June, July to September, and October to December.) It will be helpful to compare your invoiced amount and number of vehicles serviced for every quarter of 2019 and the first quarter of 2020. Keep an eye on how invoice amounts and number of vehicles during March and April of 2020 compare to last year. This will help you see the impact of COVID-19 on your business and what to expect if the virus continues to spread.
2. Client Detail Dashboard
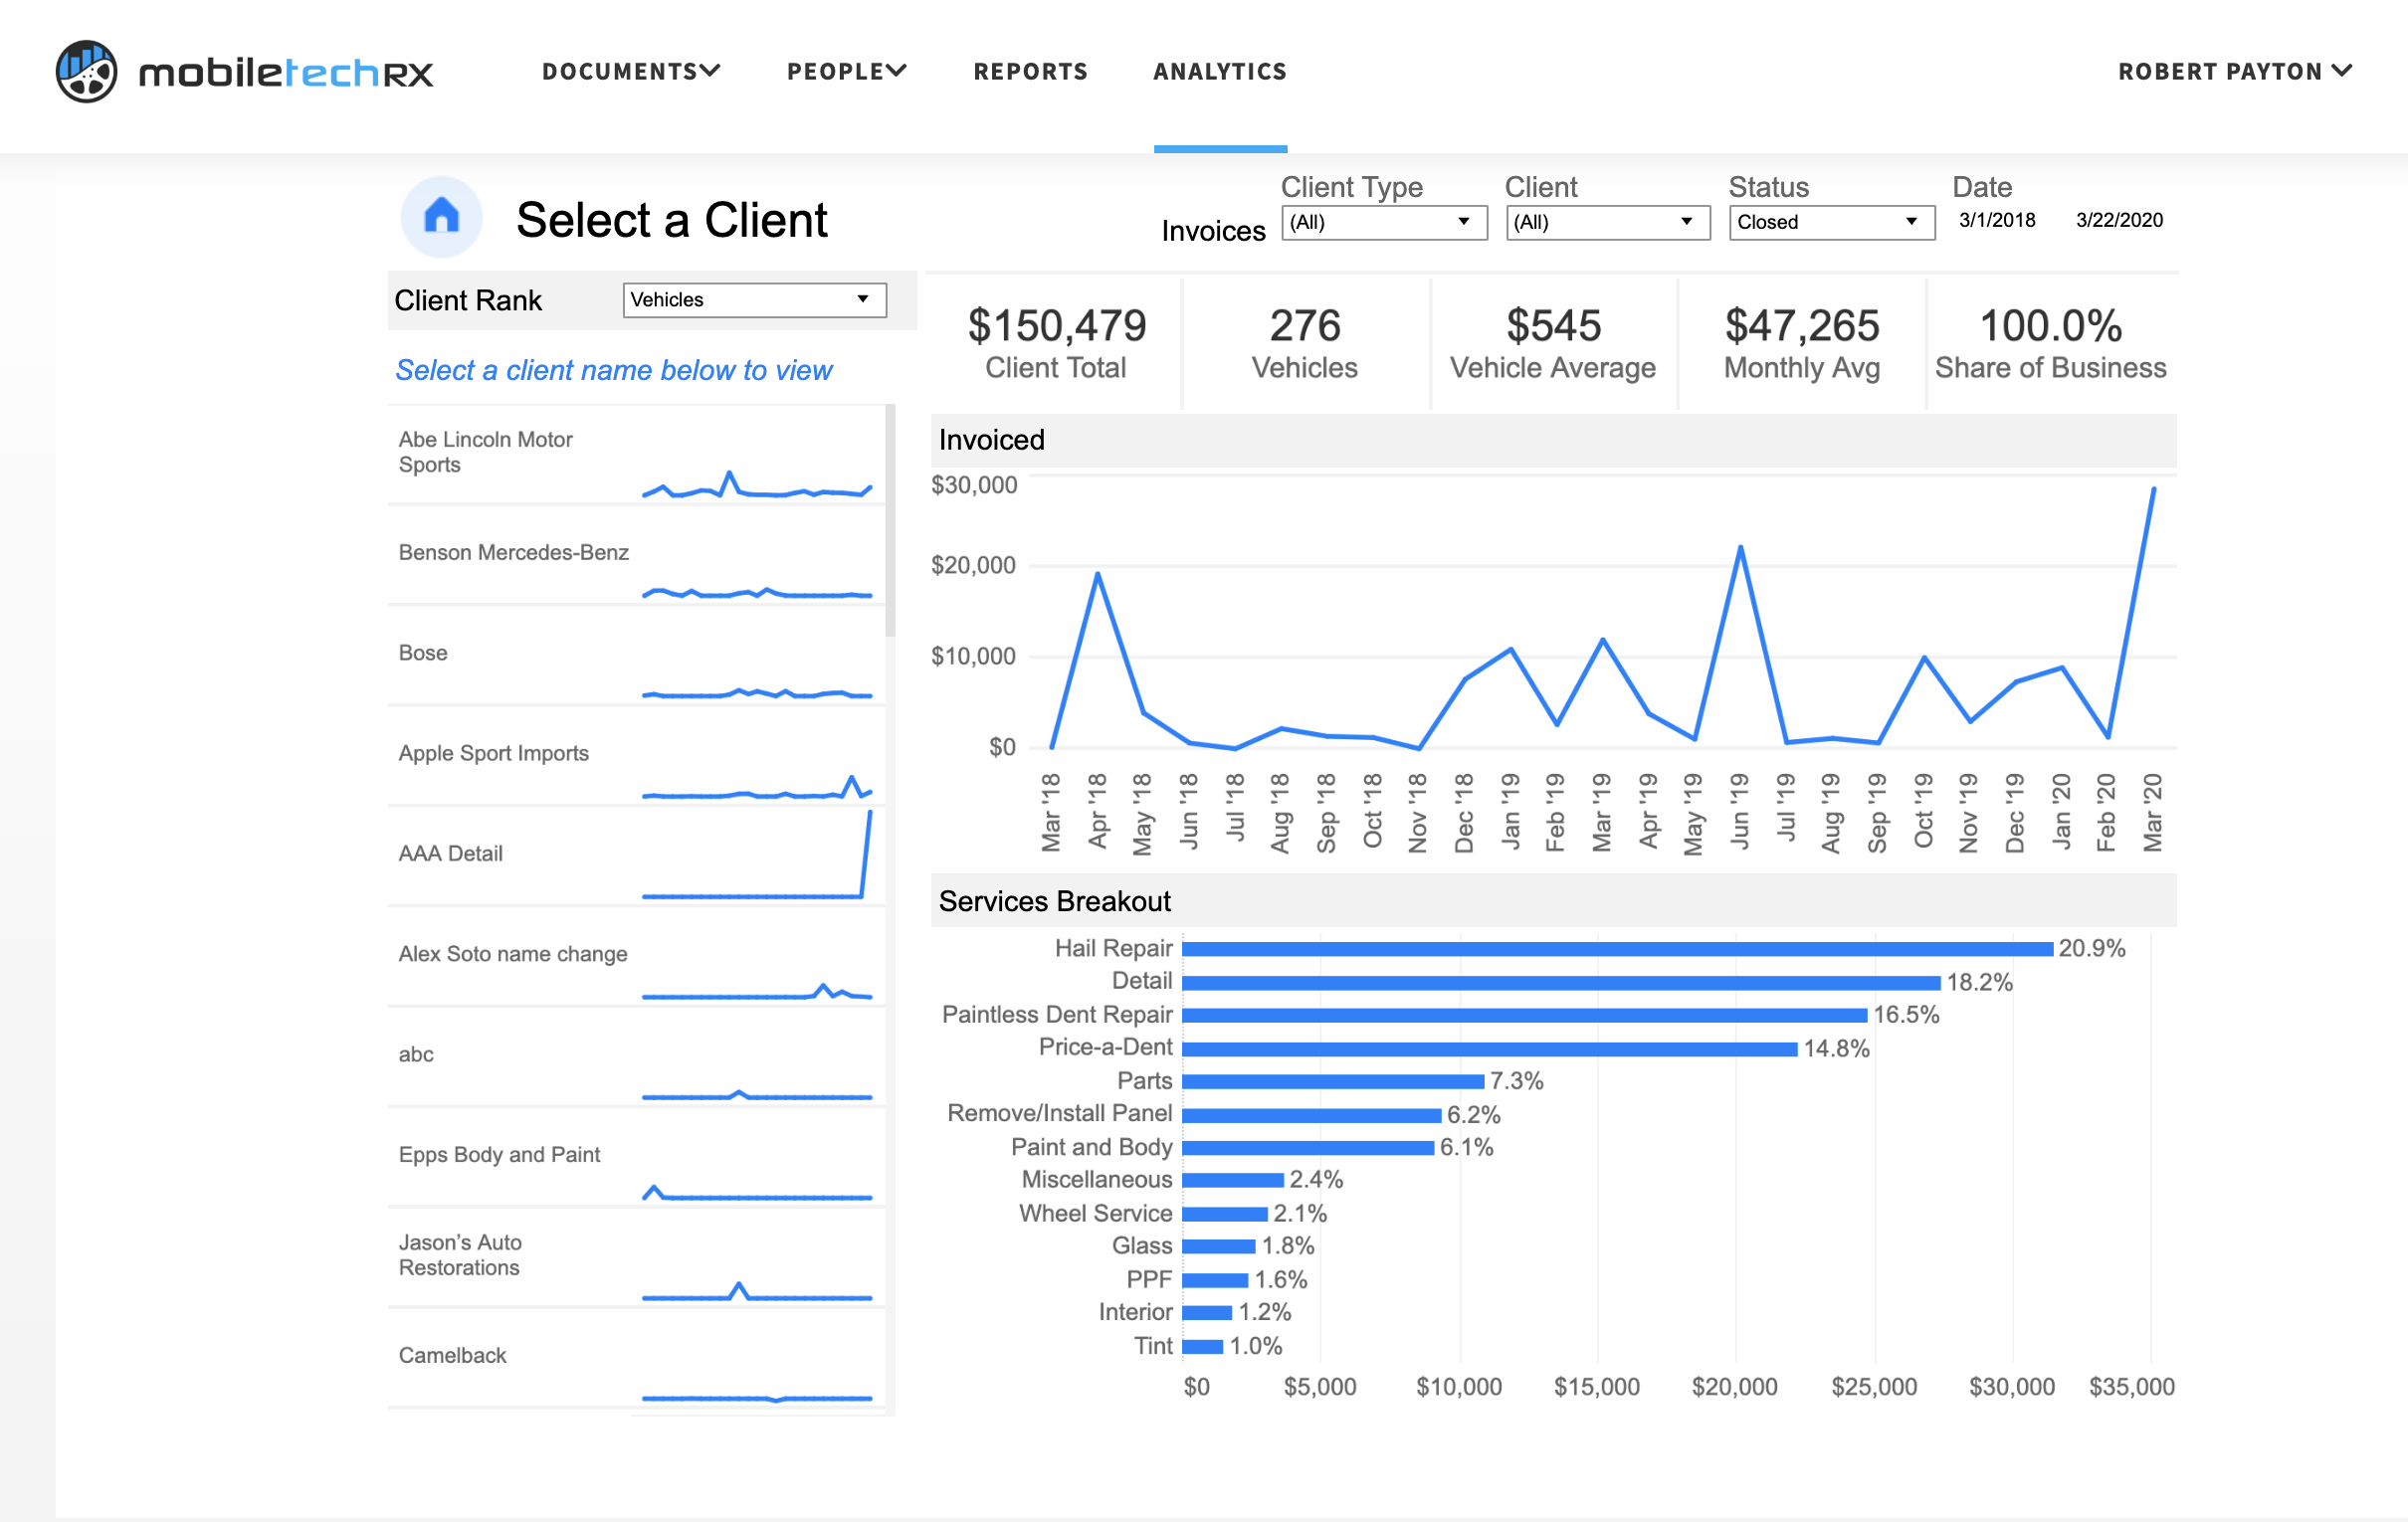
The Client Detail dashboard helps you compare your clients and what percentage of revenue they drive to your business. This data can help you determine your high-value customers that you should prioritize and find customers you’re at risk of losing.
Your goal should be to forecast future revenue so you can quickly identify if you’re trending in the right direction. The easiest way to do that is to find your repeat customers in this dashboard. Take the amount they usually pay and how often they pay it and multiply that out for the remaining 9 months in 2020. Do that for all repeat customers.
Then take the revenue from your one-off customers over the last 6 or more months and find a monthly revenue average. Multiply that by 9 for the remaining 2020 months and add it to your repeat customer number. You now have a forecast for what your 2020 revenue should look like if you didn’t grow at all.
To beat this number, your goal is to contact your repeat customers to get them serviced more often. (Do this first). Then contact your one-off customers to turn them into repeat customers. This dashboard will help you set your baseline number and prioritize which customers you should be calling, texting, or emailing today.
3. Services Dashboards
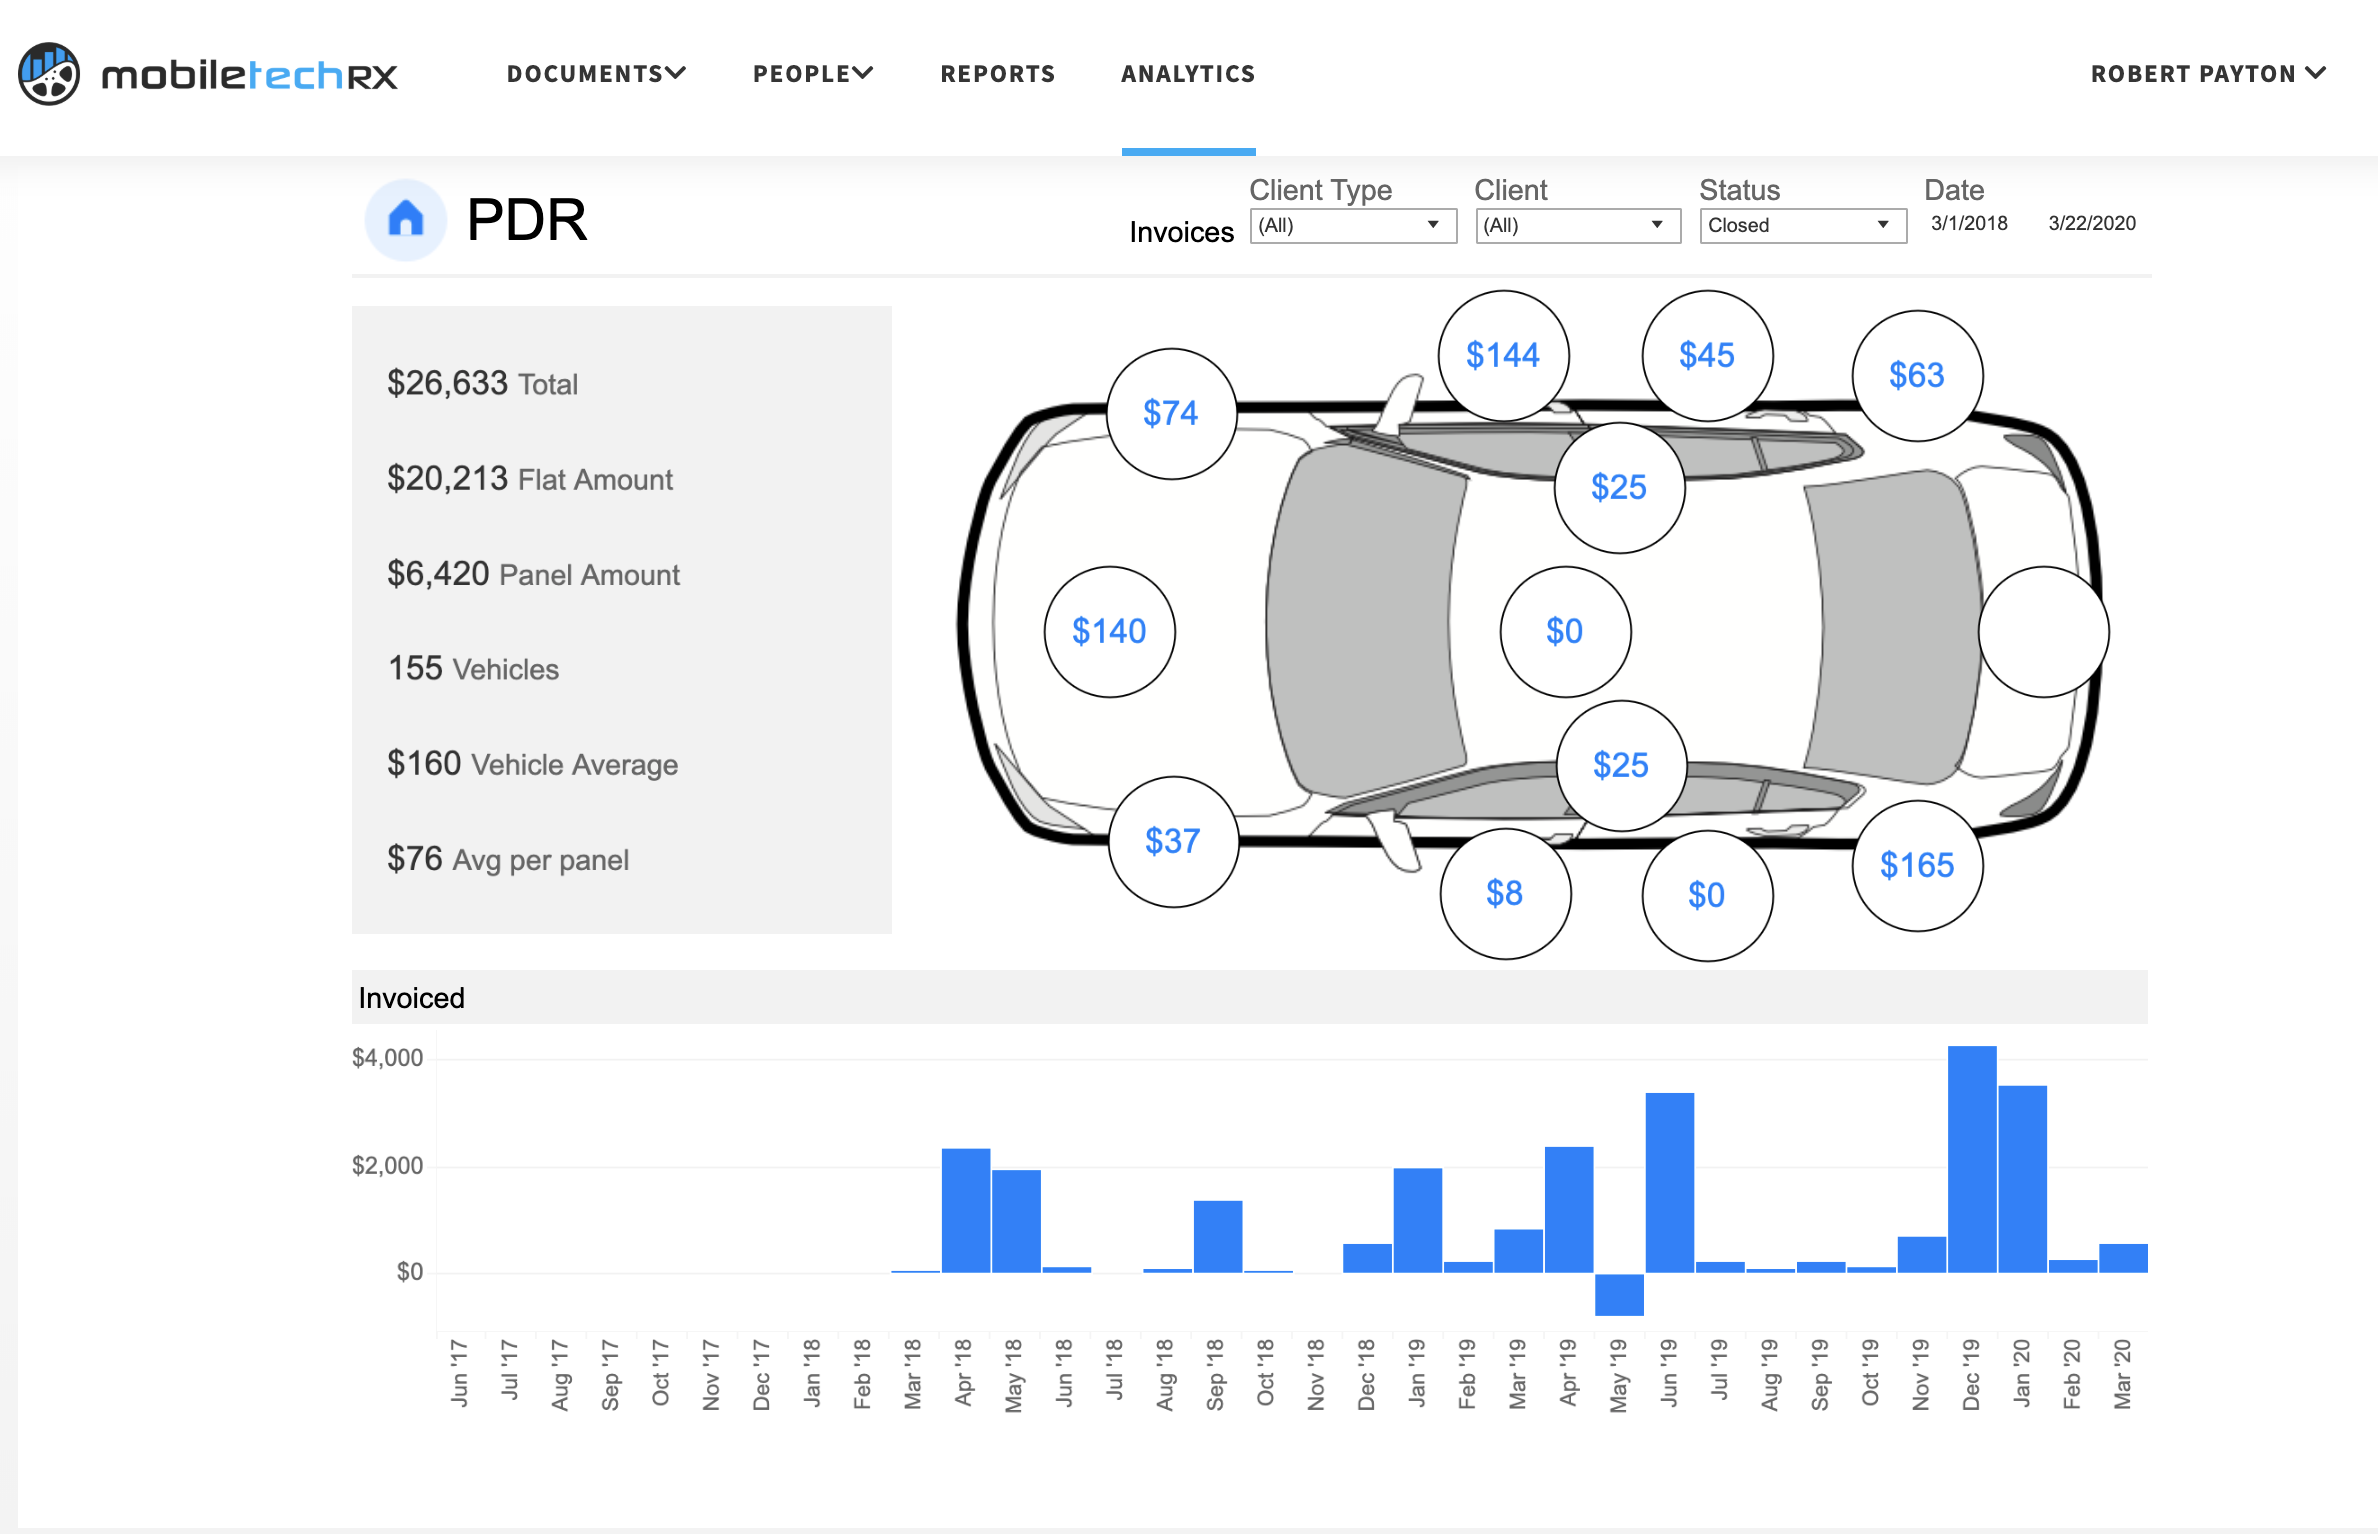
At the bottom half of the Analytics page, you’ll see icons for all of the service offerings in Mobile Tech RX. Clicking into any of the service dashboards will show you how many vehicles you serviced, what work you did on them, and how much money you made from each task. If you compare by service, it will show you what’s bringing in the most and least amount of revenue. Maybe you double down on one service and cut back on another. Or maybe you can find a place to cut costs.
Analytics Tutorial
For a walkthrough of Analytics, you can watch this tutorial video:
How to Add Analytics to Your Account
If you are a current Mobile Tech RX customer, all you have to do to get Analytics is log out and log back into your Admin portal. Analytics should now be available to you.
If you are a new customer, first sign up and create an account. After you fill out the signup form, you’ll be taken into your Admin Portal. ‘Analytics’ will be on the top menu bar. Analytics is only in your Admin Portal, not in the app.
We don’t have many answers during this time. Not many people do. But we do know how hard auto recon business owners work every day to take care of their customers and employees. We’re hoping to do everything we can to support you now more than ever. Mobile Tech RX is nothing without our users, and we hope you will be able to use this tool to make the smartest possible decisions during this time. Please let us know if we can help you get set up or answer any questions. We’re all in this together!